As part of the EIS process for the North South Bypass Tunnel the Community Reference Group is being briefed on how air pollution levels around the two stacks is being predicted.
The CRG members have found it difficult to understand the outputs and there has been a lack of information provided on how the plume coming out of the stacks will behave.
As a consequence, a CRG member undertook further research. Following is information taken from the book written by S Pal Arya 'Air Pollution Meteorology and Dispersion' which was published by Oxford University Press in 1999.
This does not attempt to be a definitive or complete review of the latest scientific theories relating to air pollution and dispersion.
It does however provide a better understanding that vehicle emissions from a 4.5 kilometer road tunnel forced out by fans will not just 'magically' disperse into the atmosphere.
The movement of plumes is unpredictable and in Brisbane where the atmosphere is subject to regular inversion layers it raises serious questions about the potential health risks to people living in the surrounding suburbs.
Is Brisbane's clean, green and liveable image to become "Just A Unhealthy Hazy Mirage"?
The Following information has been taken from:
Air Pollution Meteorology and Dispersion
By S Pal Arya
Publisher : Oxford University Press 1999
Introduction to Air Pollution
Extreme air pollution episodes when air pollution reaches excessively high levels for several hours or several days can cause extreme discomfort, diseases and even deaths among the most vulnerable people.
Extreme air pollution episodes have a high probability of occurring when there are persistent thermal inversions and weak or stagnant winds. The pollution cannot be dispersed.
Studies that investigate public health effects follow three different approaches - epidemiological, clinical and toxicological
- An epidemiological study involves the systematic statistical analysis of data from the community at large or a diseased group. It then attempts to identify associations between health effects and air pollution
- A clinical study is one that focuses on human subjects and provides data on the effects of air pollutions under controlled laboratory conditions
- Toxicological studies are studies conducted often on animals or simpler cellular systems to determine the toxicity of a substance when taken in a particular dose.
The common health hazards of air pollution are chronic bronchitis, pulmonary emphysemas, lung cancer, bronchial asthma and respiratory infections
Epidemiological studies have shown that exposure to fine particulants (PM 2.5 and less) is associated with increased incidence of respiratory illness and chronic bronchitis, decreased pulmonary function and increased mortality rates.
Even short-term exposure to a variety of gaseous air pollutants and particulate matter has been associated with increased rate of asthma attacks.
Epidemiological studies have also shown ambient air pollution has a causual role of in the development of some lung cancers.
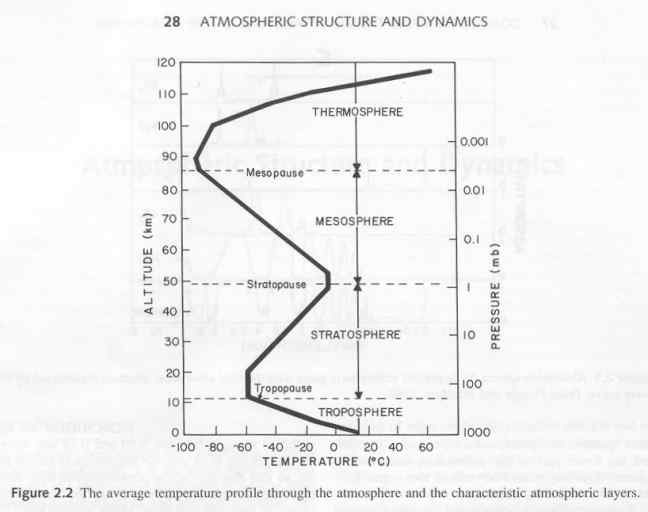
Atmospheric Structure and Dynamics
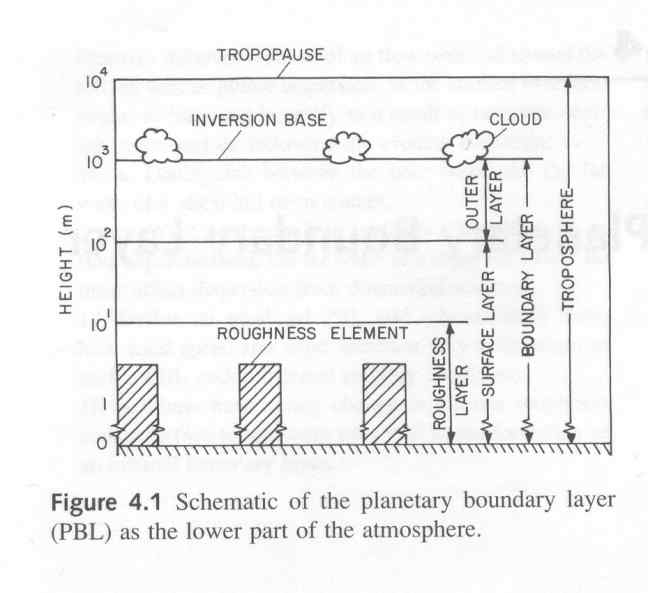
When studying air pollution the atmospheric layer of primary concern is the troposphere. (The layer closest to the ground extending to an altitude of 9km to 16 km).
The troposphere consists of 3 layers - the atmospheric surface layer, the planetary boundary layer (PBL) and the free atmosphere.
The PBL can be several tens of thousands of meters to a few kilometers deep.
Atmospheric Systems and Pollutant Transport (movement of pollutants)
Movement of the atmosphere and the diffusion of pollutants are influenced by a wide range of atmospheric systems. These being:
- Macroscale- global climate and general circulation
- Synoptic - while also macroscale these operate within timescales of less than few weeks and determine the day to day weather. They are referred to as synoptic weather systems.
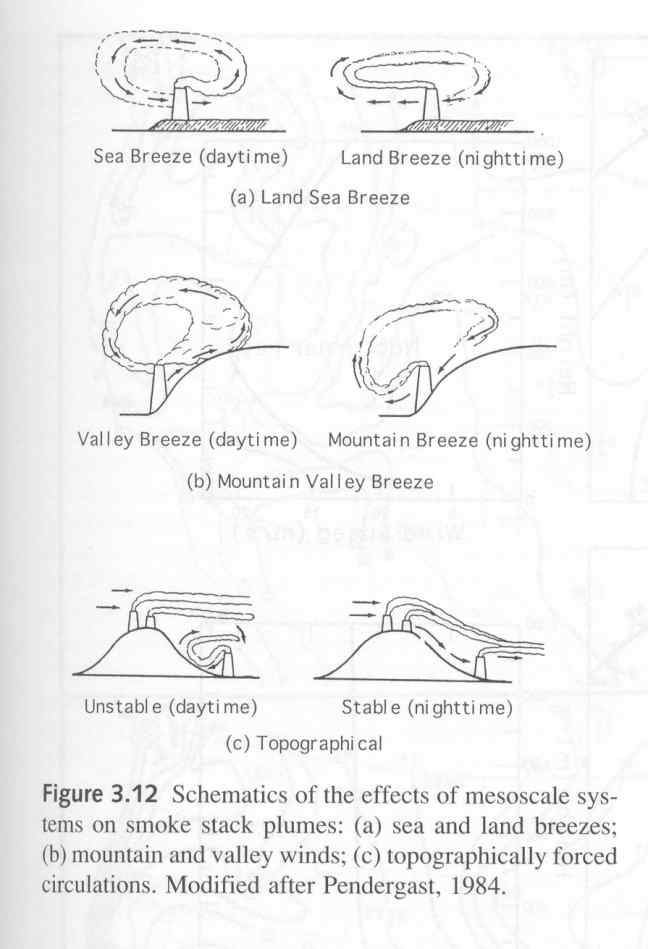
- Mesoscale - weather and atmospheric circulation systems of horizontal scales between 5 and 1000 kms. Most are associated with fixed geographical features and do not travel in space
- Microscale - these are confined to the atmospheric boundary layer. As most of the air pollutants are emitted from sources at ground or within the planetary boundary layer (PBL) the importance of the PBL winds and turbulence to their short-range dispersion cannot be overemphasized
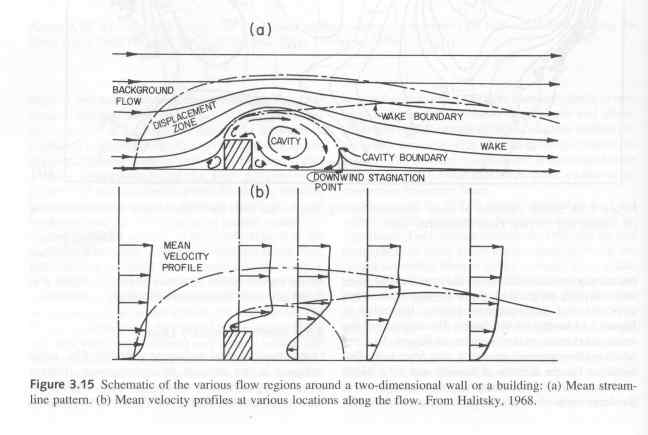
At the microscale obstacles form wakes. These obstacles can be natural (hill) or man made (tall building).
Movement of Plumes
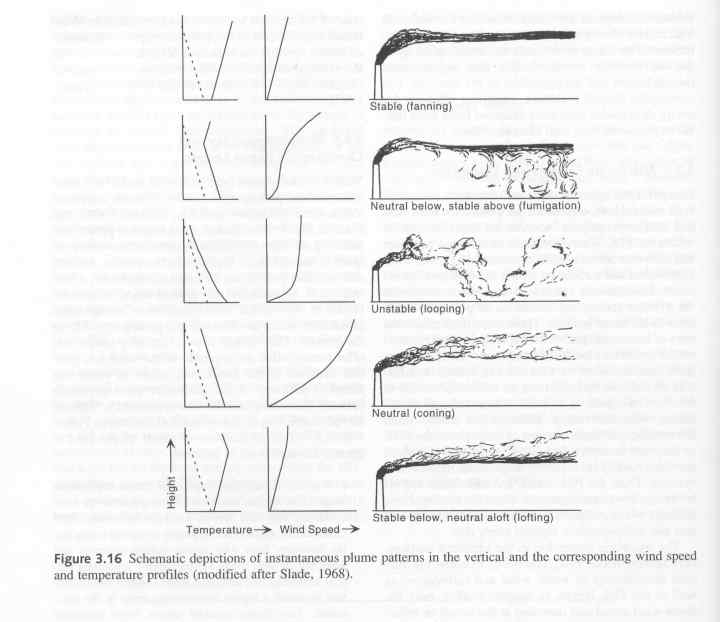
Visible smoke plumes from industrial stakes have been observed and photographed under different micrometeorological conditions. They have been observed to have characteristic plume shapes
Fanning. The plume has a large spread horizontally and very little vertically. This typically occurs at night in a very stable boundary layer with strong surface inversion and weak variable winds.
Fumigation. Is when the plume material gets rapidly brought down to the ground level due to downward mixing. This situation occurs shortly after sunrise due to surface heating and is slowly replaced by an unstable layer that grows up to the top of the plume. This condition is usually short-lived but results in the highest ground level concentrations.
Looping occurs in very unstable and convective conditions during midday and afternoon. Large convection eddies take the plume material in successively upward and downward motions.
Coning This is when the plume looks like a cone in both the horizontal and vertical scale. This usually occurs under cloudy and windy conditions.
Lofting The plume stays above the surface inversion. This occurs shortly after transition from unstable to stable conditions near sunset. The plume can be thin or become quite thick. Depending on the height of the stake and the rate of deepening of the inversion layer the lofting condition may be very transitory or it may persist for several hours.
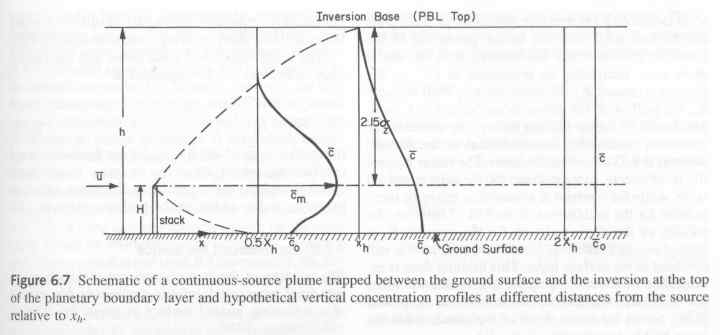
Trapping (Not shown in diagrams) Plumes released in unstable atmosphere disperse their material uniformly throughout the air (the Planetary Boundary Layer PBL). Trapping can lead to very high ground level concentrations when the inversion layer is low and there are weak winds.
The main elements of Pollution Dispersion TheoryThe development of theories (models) about how air pollution is dispersed is a complex science.
The main variables used to describe the 'strength' of the pollution are its mass or volumetric (numbers) concentration.
The mass concentration is usually defined as the mass of containment per unit volume of the fluid. The most commonly used unit of mass concentration in the atmosphere is microgram per cubic meter.
The volumetric concentration is usually defined in terms of parts per million, parts per billion areas is also used.
Atmospheric pollution is a consequence of the movement and diffusion of pollutants from a variety of sources. The air quality of an urban area depends on the total sum of all sources in that area and surrounding region. Therefore air quality models must deal with multiple sources
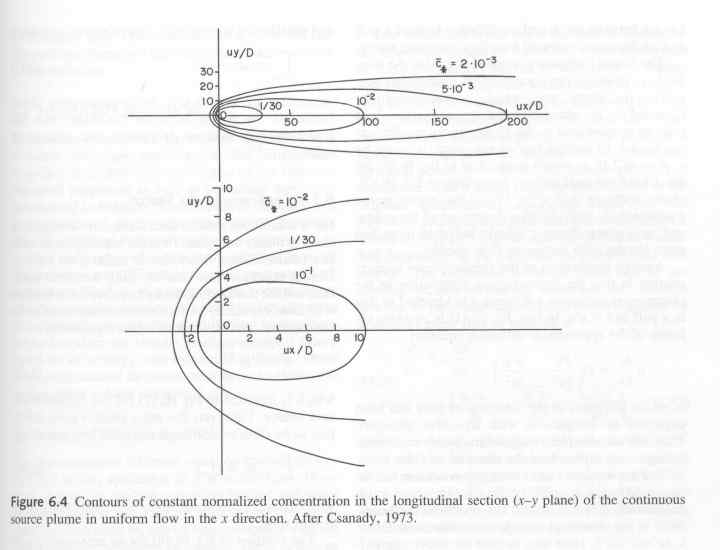
The diffusion problem of greatest interest in the atmospheric environment is that of a continuous source in a uniform flow as well as in more complex stratified shear flow
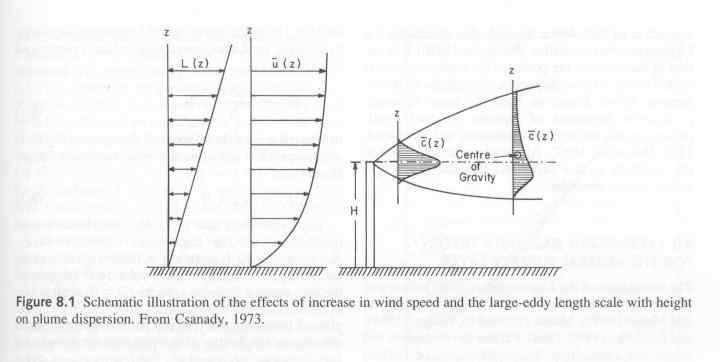
The planetary boundary layer (PBL) is often capped by an inversion and the resultant shape of the trapped plume can be described as follows
When there is an increase in wind speed a large eddy the plum shape can be described in the following way
Pros and Cons of Gaussian Diffusion Models
Gaussian diffusion models are computer models extensively use to assess the impacts of existing and proposed sources of air pollution on local and urban air quality particularly for regulatory applications
The theoretical basis of these models is limited to idealized uniform flows with homogenous turbulence
For continuous point and line sources, mean wind speed is also required to be larger than the standard deviation of turbulent velocity fluctuations so that the upstream or longitudinal diffusion can be neglected.
Mean winds and turbulence encountered in the atmosphere particularly in the planetary boundary layer (PBL) rarely coincide with these simplified assumptions. Frequently there are wind shears, turbulence and weak winds, which make the theoretical basis of Gaussian diffusion modeling somewhat tenuous if not totally invalid.
"The primary reason why these models are used is their evaluation and validation against experimental diffusion data. Much of the data used for this purpose is however limited to near-field or maximum ground level concentrations (g.l.c.) and the meteorological and source parameters that are used as input to Gaussian models. Since the regulatory emphasis is also on near source maximum (g.l.c.) the limited evaluation and validation of models against observed g.l.c. may well be justified.
Other reasons for using these models are:
- They are analytical and conceptually appealing
- They are consistent with the random nature of turbulence
- They are cheaper to use
- They have acquired an official 'blessed' status in regulatory guidelines."
There include Gaussian plume models and Gaussian puff models.
It has been observed that dispersion over urban areas compared with open country is considerably enhanced due to increased surface roughness and increased temperature and heat capacity of cities Both the mechanical (shear generated) and thermal (buoyancy generated) turbulence in urban areas are increased leading to increased dispersion including building wake effects.
The effect of urban heat island on dispersion is most pronounced at night when the stable stratified rural boundary layer approaching the city is modified by the relatively warmer surface.
Limitations with the Gaussian Diffusion models occur due to simplifying the assumptions and simplified model physics. More sophisticated numerical models must be used to simulate and predict dispersion in complex flow conditions.
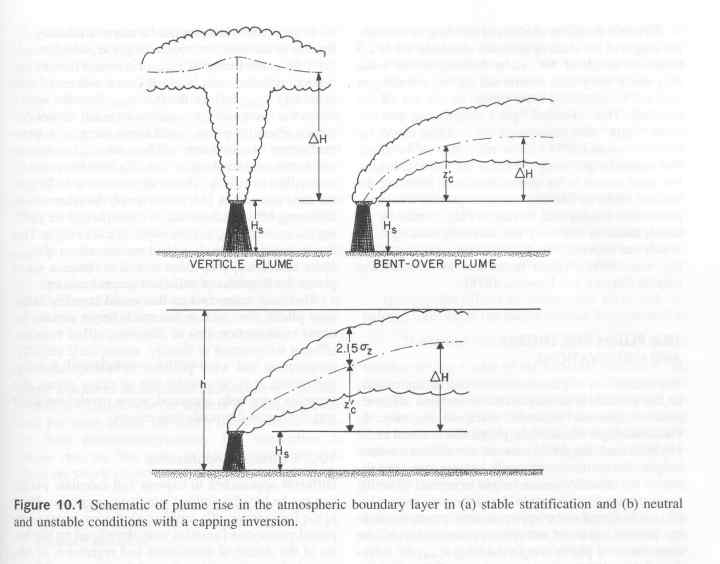
Plume Rise Settling and DepositionMany sources of air pollution release material in the atmosphere with some initial momentum and positive buoyancy which make the puff or plume rise gradually while dispersing under the influence of both the source generated and naturally occurring turbulence.
In some cases when cold dense gas is released and/or coarse particulates are in the emissions the trajectory of puff or plume actually falls downwind from the release point.
In general the material released into the atmosphere may often have velocity and density different from those of the ambient air and its behavior is likely to differ from that of a passive release.
To better understand the dispersion of these materials we need to understand the possible effects of initial momentum and buoyancy of release on subsequent rise or fall on the mean puff or plume trajectory.
The Rise of Hot Plumes
'Hot' plumes (from sources such as power generation facilities or industrial facilities) - because of the momentum and buoyancy result in the plume center being raised well above the initial height of release and this also enhances the 'near source' dispersion due to the turbulence from the stack.
The Fall of Cold Dense Plumes
Dispersion of cold dense gases ( the plume from the NSBT will be cold) is very different from hot plumes. Because of gravity these plumes are quickly brought down to the ground. But when the release is assisted by pressure (or as is proposed in the NSBT - fan forced) the plume can rise to a considerable height before falling to the ground level due to gravity.
There have been a limited number of cold plumes wind tunnel experiments. But those done have shown that in early stages the plume rise is governed by the initial momentum and internal turbulence of the jet, but environment wind shear and turbulence play greater roles in bending and dispersing the jet and its eventual touchdown in later stages.
Not yet able to find a diagram showing cold plumes dispersals.
(If you find some please send them to the e-mail address below)
Stack Downwash
When effluents come out of a vertical stack at low speed or low mean vertical velocity and the horizontal flow around the stack is sufficiently strong the plume may be drawn down in the low pressure region in the near wake of the stack. The is known as "stack downwash'.
A similar phenomenon occurs around buildings when a plume is release from a rooftop or downwind side of a building - is it called 'building downwash'. The 'downwash' has the effect of reducing the effective height of release there by increasing the ground level concentrations.
Stack downwash can be avoided if the average exit velocity in the plume is more than 1.5 times the mean wind speed at the stack top.
To avoid the adverse effect of building downwash the height of the stack should be 1.5 to 2.5 the height of the nearby building whose wake can cause the plume downwash and its entrapment into the lee of the building. This is called 'good engineering practice stack height'.
This 2.5 rule has been shown to be effective in reducing the adverse effect of building wake on ground level concentrations. It may be relaxed however for very tall and thin buildings - whose wake effects may be as low as 1.5 building heights.
Plume Rise Theory and Observations
The calculation of plume rise is of crucial importance to the prediction of dispersion of buoyant effluents from a stack (or emissions from a road tunnel)
In Gaussian dispersion models plume rise is added to the physical height to estimate the effective source height. Except in strong winds plume rise may increase the effective source height to 2 to 10 times the actual stack height.
"Unfortunately plume rise may not be estimated to a great degree of accuracy because most of the plume rise theory and models are semi empirical and contain empirical constants and coefficients with large uncertainties in their values"
"There are many factors that could possibly influence plume rise, such as stack height and its internal cross section area or diameter efflux velocity, effluent temperature or density, atmospheric stability and others. It is no wonder that so many plume rise formulas have been proposed, some purely empirical and dimensionally nonhomogeneous."
Different Approaches to calculating plume rise
These can be divided into three categories
Purely empirical plume rise formulas - developed on statistical correlation and regression of observed plume rise with a few of the relevant effluent and environmental variables
- Empirical but based on dimensional analysis and similarity. Most of these were found to be consistent with plume rise data and plume rise theory based on the conservation equations of mass, momentum and energy.
- The best theoretical approach is based on the fundamental fluid dynamic equations expressing the conservation of mass momentum and buoyancy or thermodynamic energy for buoyant plumes and momentum jets
Gravitational Settling of Particles
In considering the dispersion of particulate matter one must take into account the gravitational settling of particles and the possible influence of this on their mean trajectory.
Gravitational settling is an important mechanism for the removal of particles from the effluent or plume and their deposition on the surface - there are a number of formulae that describe this.
Dry Deposition"Dry deposition refers to the transfer of airborne material both gaseous and particulate to the earth's surface including soil, vegetation and water (and people) - where it is removed"
The transfer process leading to dry deposition on a surface can be divided into three stages, depending on the transfer mechanism involved.
1. First stage - involves the material traveling through the atmospheric surface layer to the immediate vicinity of the surface. The mechanism for transfer is surface layer turbulence. This stage is also known as the aerodynamic component of transfer.2. Second stage - involves the diffusion of the material through the molecular sub layer adjacent to the surface itself. The primary mechanism of transfer through this very thin layer (in the order of millimeters) is molecular although turbulent transfer occurs intermittently.
3. The third stage is called the substrate transfer component- this involves the absorption of the material and its removal from the surface through chemical and biological processes(eg: lungs). The solubility or absorptivity of the diffusing matter at the surface determines how much the material is actually removed in this final stage of the substrate transfer and deposition process
"Nonreactive gases such as argon and helium are not removed at all by dry deposition. Other gases might be removed through dry deposition on vegetation, wet soil and water surfaces but not on dry, bare surfaces"
Numerical Dispersion ModelsThere are various theories of dispersion in turbulent flows.
The simpler Gaussian dispersion models with empirical dispersion parameters or coefficients, which are used for regulation, have many limitations and uncertainties associated with them.
All analytical dispersion models assume a flat and uniform surface that simply reflects rather than absorbs the pollutants reaching it and idealized ( horizontally homogenous and quasi stationary) atmospheric boundary layer (PBL). The limit to vertical diffusion by capping inversion at the top of the PBL is considered by some of these models on an ad hoc basis.
"These analytical dispersion models may not be applicable beyond a downwind distance in the order of 10 km from a continuous point or line source. Even for shorter distances transport (ie:movement) and diffusion phenomena are greatly simplified and parameterized in these models."
Numerical dispersion models are the next level of refinement in dispersion models. They have improved model physics, more accurate boundary layer and turbulence parameters and consider the inconsistencies in the surface.
Short range gradient transport (movement) models
Numerical dispersion models permit have an ability to specify more realistic boundary conditions, various eddy effects and height dependant winds.
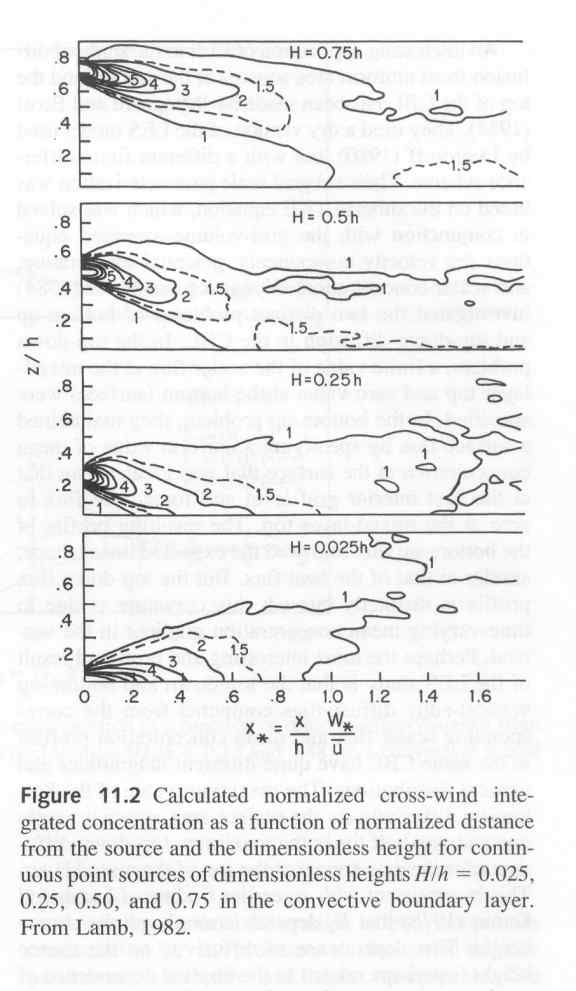
The three dimensional large-eddy simulation (LES) is currently the best available approach to atmospheric turbulence and diffusion modeling
It is computationally the most expensive approach generally requiring the use of super computers.
Figure 11.2 shows the calculated nondimensional cross-wind integrated concentration distribution for continuous point sources of different dimensionless heights
Urban and Regional Air Quality Models
The book then goes on to describe in 17 pages the components of a regional air quality model.This has not been abbreviated.